

%201.png)

Site and paid search, rebuilt as one system
KEY TAKEAWAYS
-5.8× return on total investment, agency fees included, March to August 2026.
-Revenue per ad dollar tripled on 59% less ad spend.
-The first three months ran no campaigns. They built the measurement everything else ran on.
The situation
We met Ivan Cornejo at an LBAN event in Denver in October 2025. LBAN, the Latino Business Action Network, runs the Stanford program we came through, and its events are where several of our engagements have started.
Aether Mechanical was a working HVAC contractor with real demand and a website that could not help them capture it.
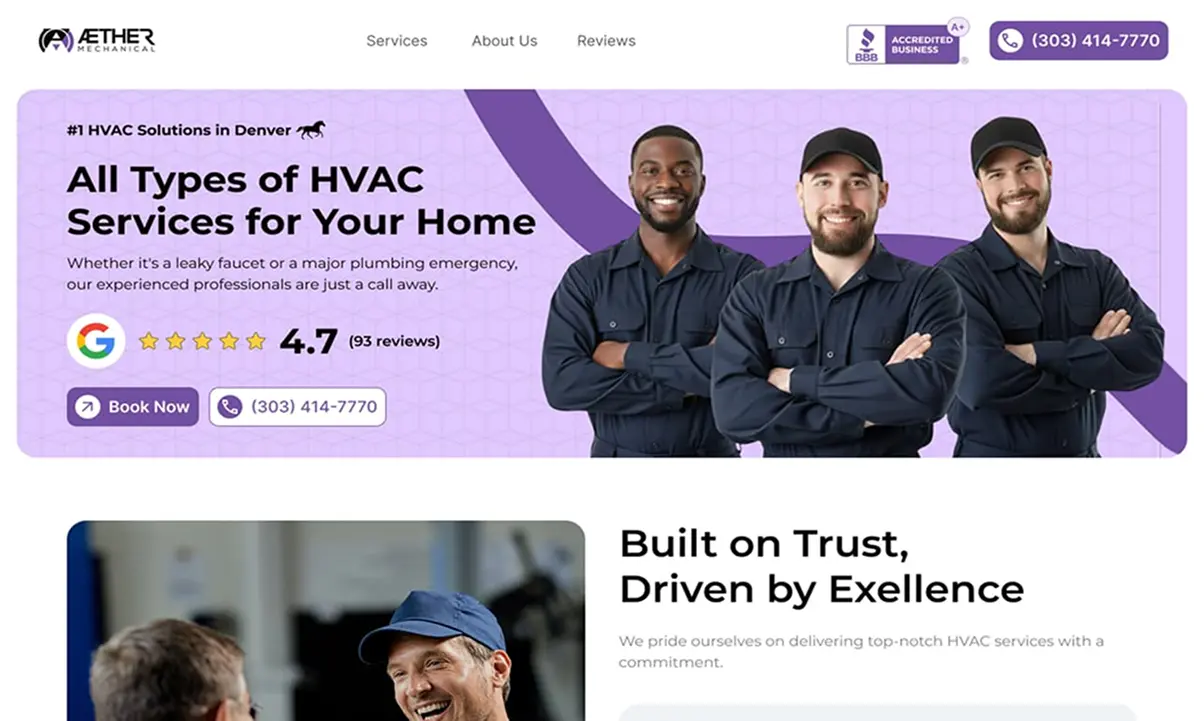
The site was a six-page brochure on a 2021 WordPress theme. Six broad service categories for a trade where customers search by service and by city. Generic URLs, no keyword-aware titles, one contact form, no blog, no structured data.
The measurement layer did not exist either. No conversion tracking. No privacy policy. No backups before changes. A Google Business Profile with no phone number, misaligned hours and no secondary categories.
And the part that mattered most: of 634 jobs completed that year, exactly one had its lead source correctly recorded. The business could not tell which marketing produced which job.
Work started November 3, 2025.
What we did
Months 1 to 3 — build the foundation. No campaigns, no lead generation. Conversion tracking on November 14. Security and backups on November 24. A new site architecture, designed against a competitive analysis, on November 26. Privacy policy on November 28. Blog live on December 18. Google Business Profile rebuilt starting January 14.
The redesign was SEO-first, not SEO-after. The six-page brochure became a 45-page structured site: 25 trade-specific pages instead of 6 broad categories, geo-targeted URLs like /ac-repair-denver-co/, titles built around service plus city, FAQ schema, and four distinct conversion paths where there had been one generic form. The new site went live at the end of January.
Month 4 onward — acquisition. Paid search and Performance Max campaigns started in March. Content, on-page SEO and Local Services Ads followed. In August we built the attribution system that finally connects a click to a completed job.
The sequence matters. The first three months were not trying to generate demand. They were building the platform that everything after them ran on.
The results
5.8× on everything invested
March to August 2026, the Google channel returned 5.8× the full cost of the engagement — media plus our fees.
We report it this way on purpose. Most agencies quote return on ad spend, which conveniently leaves out what they charge. Counting our own fee is the only version of the number a business owner can actually use to decide whether the work paid for itself.
Media efficiency tripled
Nov 2025 – Feb 2026Mar – Aug 2026Revenue per dollar of ad spend1×3×Ad spendbaseline59% lessChannel revenuebaseline24% more
The channel produced 24% more revenue on 59% less budget. This is the cleanest number in the engagement because it is a ratio, not a total. It does not depend on the window we picked or on which jobs are counted.
We report ratios rather than amounts throughout. A multiple tells you whether the work paid for itself. A dollar total tells you what our client bills, which is not ours to publish.
The Google channel grew 50.7%
Comparing January 1 to August 5 of each year, revenue attributed to the Google channel grew 50.7%, and jobs from that channel grew 29.2%.
Search visibility grew 775%
Monthly organic impressions went from 2,080 in October 2025 to 18,209 in July 2026. Organic clicks grew 50% over the same window.
The honest read: the site now appears in far more searches, but it appears lower. Average position moved from 15.6 to 25.2, because the site is now surfacing for hundreds of terms it was invisible for before. Terms like ac repair denver and furnace installation denver, which did not appear at all, now rank at #21 and #22 with thousands of monthly views each. Moving those onto page one is the work in front of us.
This is visibility, not traffic. We are counting it as a leading indicator, not as a result.
The business context
Over the same period, Aether's core revenue grew 88% year over year, excluding one atypical commercial project from the prior year.
We are not claiming that number. The Google channel grew 50.7%, below the business as a whole, and its share of core revenue declined. Aether's growth came from more jobs, not higher prices: billable jobs rose 89% with average ticket nearly flat. Digital demand was one lever. The other, larger one was capacity — the depth of the technical team improved sharply, with four technicians carrying real volume where one had carried 97.5% of revenue the year before.
What we can say is this: when a business doubles its job volume, marketing has to hold up its side. Ours did, at three times the efficiency it started with, and returned 5.8× on what it cost.
What this applies to, beyond HVAC
Fix measurement before you spend. Aether spent 2025 unable to tell which marketing worked, which meant every budget decision was a guess.
That is not a contractor problem. It is what happens in any business where the website, the ad account and the system that records a sale were built by three different people at three different times. A law firm counting form submissions. A manufacturer whose quotes arrive by phone and never get tagged. An online store that knows its traffic and not which campaign produced the repeat customer. Different industries, same symptom: plenty of activity, no way to tell which of it pays.
The test is a single question. Ask who produced your last five customers, by name and by source. If the answer is a percentage, the problem is measurement and not marketing.
The single highest-return thing we did here was not a campaign. It was making the business legible to itself.
See the design work
This article covers what happened. The design case covers what was built: the site architecture, the wireframes, the previous design and the rebuild, screen by screen.
Aether Mechanical: the full design case →
Engagement ongoing since November 2025. Figures from ServiceTitan, Google Ads and Google Search Console.
.webp)
If not, the problem is measurement, not marketing. A Growth Audit starts there, and you keep the findings whether or not you hire us.

Not sure where your site is losing customers?
A Growth Audit tells you which pages already convert, which searches you are invisible for, and whether your inquiries record a source.
You keep the findings either way.